7.1 Residential Data
From the top-down analysis, residential energy consumption represents 44% of energy demand in Greystones and Delgany.
To review the residential sector further, national residential data was obtained from the Central Statistics Office (CSO), and the granular town data was obtained through the CSO’s Small Area Population Statistics (SAPS), which lists the housing stock present in a small town by house type and year of construction. Approximately 6256 dwellings were recorded for the area covered by Greystones and Delgany SEC.
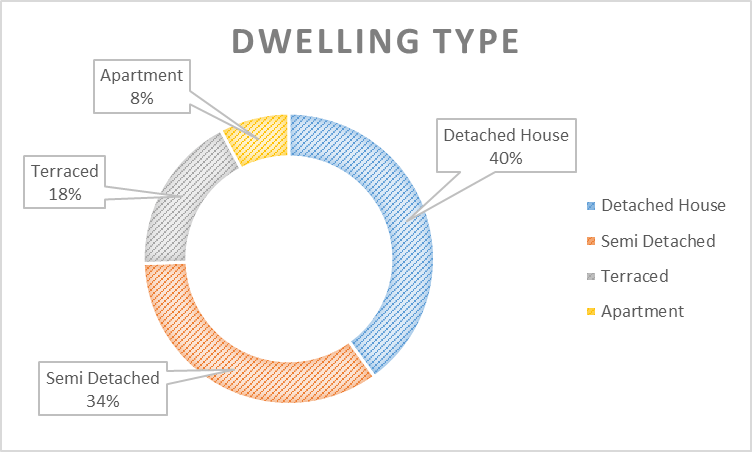
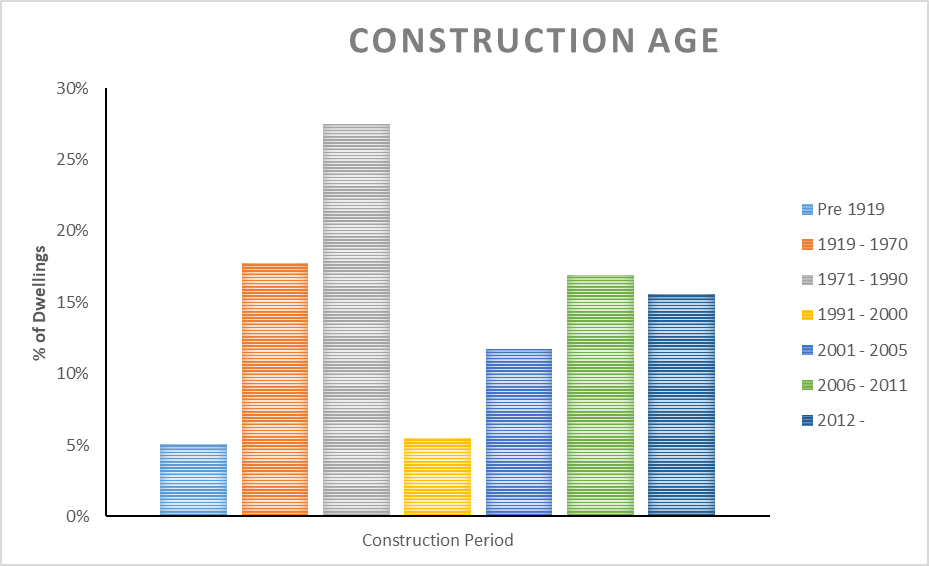
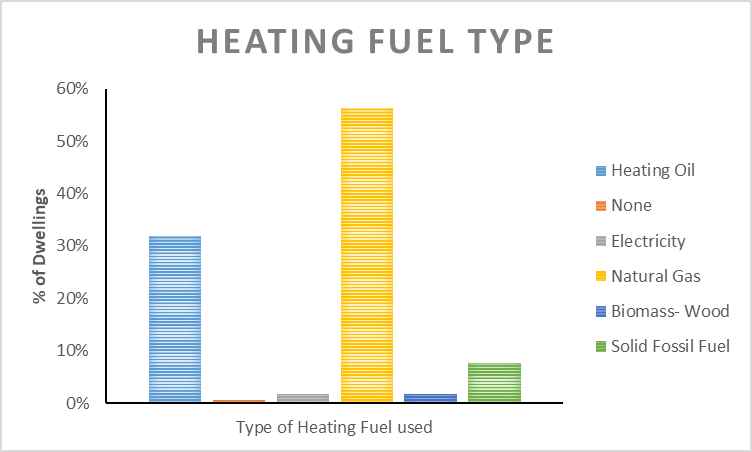
Figures 9 – 14 show the dwelling types, age of construction, heating fuel source and average energy use per dwelling based on year of construction.
The most common house types are detached or semi-detached with approximately 60% constructed prior to 2001, there is a large scope for implementing energy efficient measures in these dwellings.
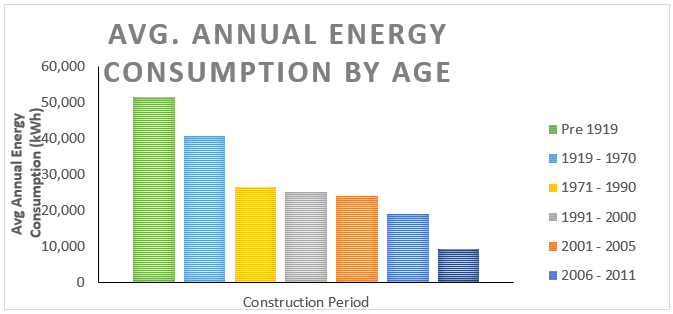

Note that the data shown in Figure 12 is representative of a 150 m2 semi-detached house with an oil or gas central heating system.
Bottom-up analysis was completed using data from the online surveys and energy audits conducted by 3cea Energy Engineers. The response rate and data obtained reflects a small percentage of the local population (approx. 100 residents in the local area). Analysis of the responses received, and results of the energy audits carried out produced the following results:

Oil represents 31% of fuel type reported by residents through our bottom-up survey. This can be compared with the Top-Down figure of 52% (28% oil and 24% Natural Gas) of energy demand by fuel type. 14% of fuel is attributed to solid fuels such as coal, briquettes, wood, and peat.
7.2 Commercial/Business Data
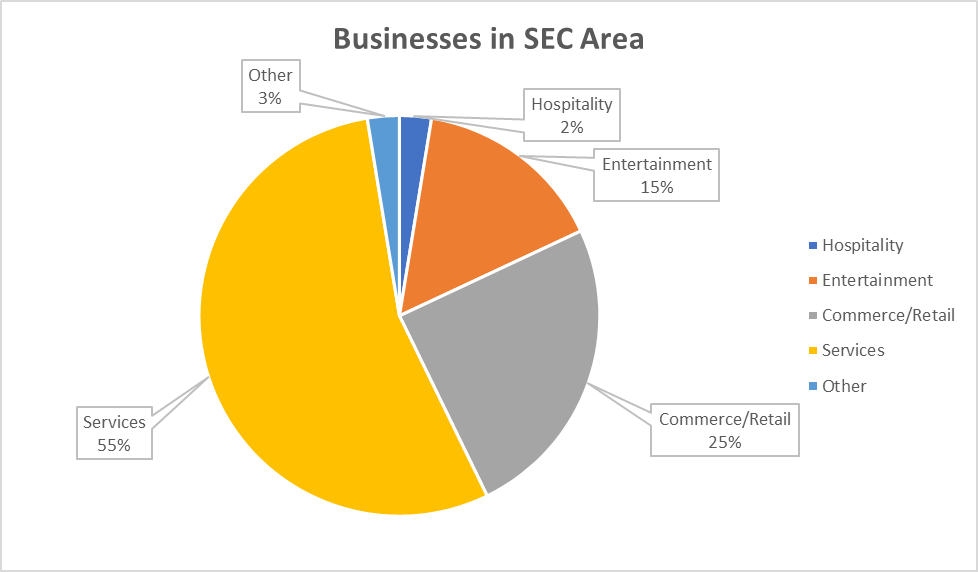
From the top-down analysis, commercial/business energy consumption represents 28% of the energy demand in Greystones/Delgany. To review the commercial sector further, national and county level commercial data was acquired through SEAI’s ‘Extensive Survey of Commercial Building Stock in Ireland’ and broken down to local level using GeoDirectory and Local Business pages. There are approximately 189 businesses operating in the area covered by the Greystones/Delgany SEC area, encompassing the sectors displayed in Figure 15 below.
The SEAI report ‘Extensive Survey of Commercial Building Stock in Ireland’ in conjunction with the ‘Energy in Ireland 2019’ report allowed analysis of the Top-Down Data, producing the following results regarding energy consumption and associated emissions in the sector:

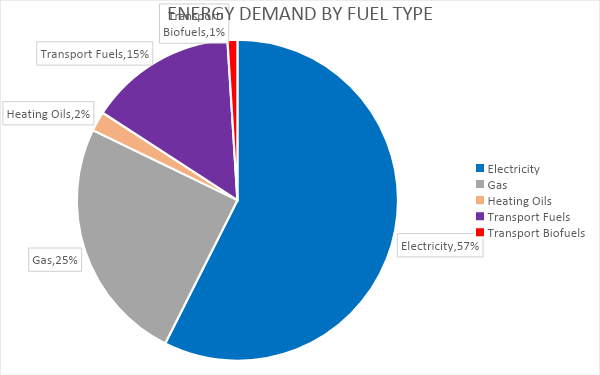
The dominant fuel type used nationally in the commercial sector is electricity, as is demonstrated in Figure 16.
There were no survey replies from businesses in the SEC area so an analysis of the energy consumption in the commercial sector by fuel type was not performed.
7.3 Transport Data
From the top-down analysis, transport energy consumption represents 11% of energy demand in Greystones/Delgany.
To review the transport sector further, national and County level data was obtained through the National Travel Survey (NTS) conducted by the Central statistics Office. The granular town data was obtained through the CSO’s Small Area Population Statistics (SAPS), which records commuting times, methods of commuting, and numbers of households with private vehicles.
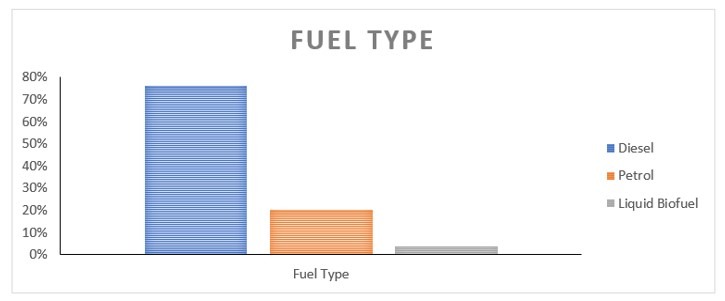
Figures 17 – 20 show the commuting methods, commuting times, vehicle type and fuel type for transport options for Greystones/Delgany.
Most people commute using a private vehicle, with public transport being the second most utilized method of transport.
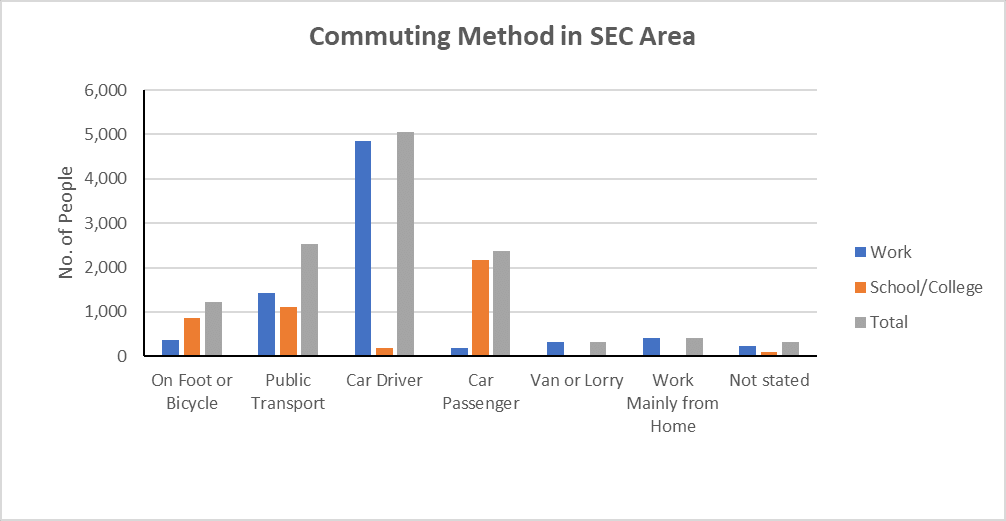
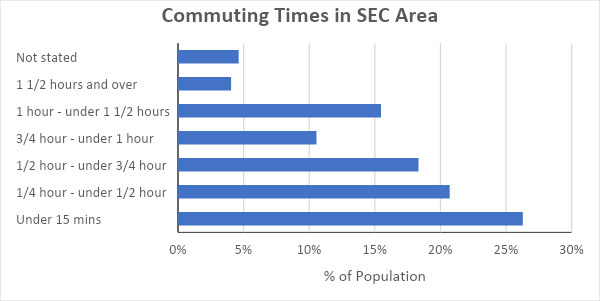
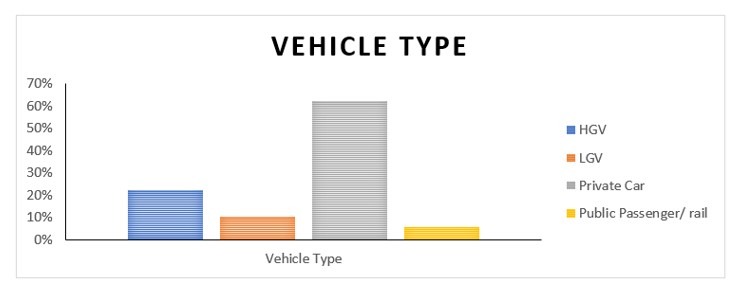
Figure 19: Energy Demand by Vehicle Type – Source: CSO, 2016
Bottom-up analysis was conducted using the data collected from the residents within the SEC area through online surveys.
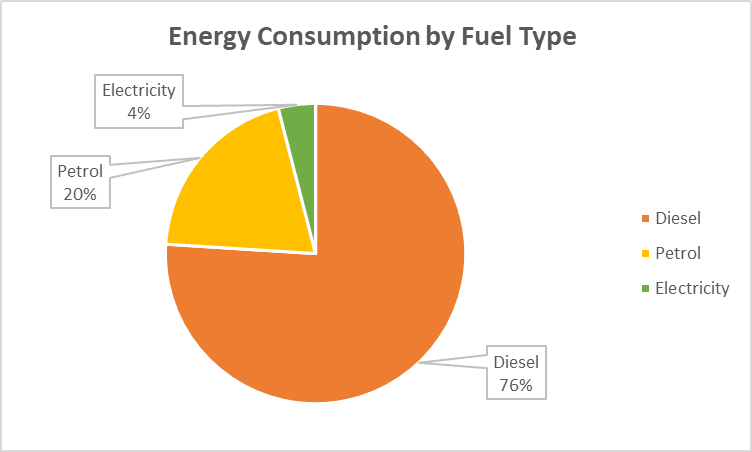
Analysis of this data shows it deviates slightly from the top-down data where diesel, at 76% transport energy demand, represents a vastly predominant portion of fuel type used by vehicles. Electric vehicles account for a low number of vehicle owners.
The bottom-up transport data is representative of the commuting methods, commuting times, vehicle type and fuel type in Greystones/Delgany. Transport data from the bottom-up survey did not include tourists visiting, bus, Dart or other transport options in the area and therefore the carbon footprint of transport in the area could significantly exceed the data available.
A small number of residents own electric vehicles in the area these may have not been captured by the 2016 census data as national data shows us that the largest numbers of electric cars have been sold within the last two years.
Services such as ample electric vehicle charging points and increased public transport options can help reduce the emissions associated with all transport without inhibiting the volume of visitors to the region.
It is not reasonable to expect everyone to immediately switch to electric vehicles, but it is possible to provide alternative options to encourage people to reduce the use of petrol and diesel vehicles. Improved foot and cycle pathways will encourage people to travel by more sustainable modes of transport, simultaneously allowing users to appreciate fully that natural beauty of the area. Creating pedestrian only areas, even if only on weekends, can motivate the community members and tourists alike to leave the car at home.
7.3 Community & Public Sector Data
From the top-down analysis, community and public energy consumption represents 19% of energy demand in the Greystones/Delgany SEC area. This sector includes all public sector buildings, schools, community centers, sports facilities etc. There are several community buildings in the area including two community centers, two churches, two adventure centers and a community sports field.
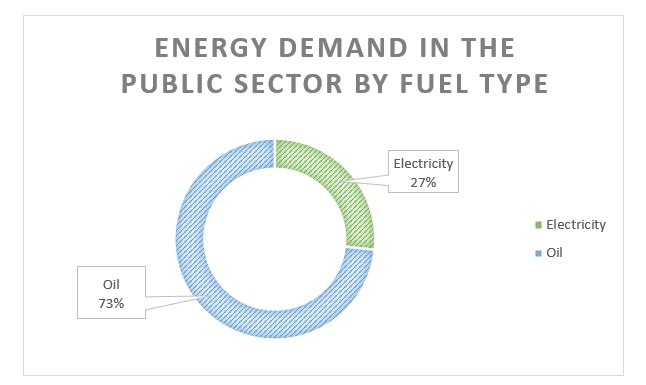
National and County level data was acquired through SEAI’s Annual Public Sector report and Public Bodies Energy Reporting. The data was further broken down to local level using percentage of population figures. Analysis of the top-down data provides the following results:
Bottom-up analysis was conducted using the data collected from surveys and audits of building in the SEC area generates a different picture however, as mentioned previously, this data is based only on the information received from the community. It is in line with the Top-Down Data in as much as electricity holds the largest share of energy consumed in the sector.